Survey nonresponse can bias estimates when core substantive measures are correlated with nonresponse propensity. This analysis of 18,000 older adults from the 2014 Health & Retirement Study (HRS) revealed that:
- Experimental module subsamples are representative of non-institutionalized older adults
- Unit nonresponse did not vary by module topic
- Nonresponse propensity is systematically associated with some substantive variables
- Nonresponse propensity did NOT moderate multivariate relationships between substantive variables
Even though nonresponse bias was uncovered on a number of substantive variables, multivariate analyses consistently showed that substantive model results are not moderated by nonresponse. Hence, researchers who are looking to generate point estimates should make some effort to assess nonresponse bias; whereas researchers who are looking at multivariate model output may be less likely to uncover effects of nonresponse bias.
HRS Experimental Modules
The Health and Retirement Study (HRS) is a longitudinal panel survey representing Americans over age 50. After completing the 2014 HRS core interview, around 18,000 respondents were randomly assigned to 1 of 11 modules of supplemental questions spanning a wide array of topics, namely:
1. Traumatic Brain Injury
2. Time Discounting
3. Decision Making
4. Health Technology
5. Probability Judgments
6. Meaningful Work
7. Mental Health
8. Alcohol Use
9. Arts Participation
10. Money Management
11. Expectations of Longevity
However, not all HRS respondents who were assigned to a module completed it. This analysis focuses on whether nonresponse in these modules compromised the accuracy of survey estimates. Documentation and data from the HRS are in the public domain and can be found here.

Ignorable vs. Nonignorable Nonresponse
A critical distinction should be made at the outset. Survey nonresponse merely increases the risk of bias in survey estimates; that is, nonresponse does not necessarily result in bias. The degree to which survey nonresponse is problematic depends on the extent of association between the core substantive measures and nonresponse propensity. If respondents who are difficult to reach or reluctant to participate have different responses on core measures from the respondents who are easy-to-reach, then we have a problem of systematic bias. Conversely, nonresponse may be ignorable if it is random and not associated with core substantive measures.
There is an outstanding collection of academic studies on this topic here.
How Representative are Module Subsamples?
Module subsamples differ slightly from population demographic parameters, in part by design because modules are administered only to non-proxy respondents who can answer for themselves. When comparing respondents who were willing vs. not willing to complete the experimental modules, we discovered that:
- Older respondents (75+) were more likely than younger respondents to refuse to participate
- Respondents with household income less than $30,000 were more likely to refuse to participate
- Respondents with less than high school education were more likely to refuse to participate
However, because the vast majority of respondents (over 90%) agreed to participate, these trends above resulted in very little change in the module sample demographics. As shown in table below, the module subsamples are representative of non-institutionalized older adults.

Nevertheless, respondents who were willing to complete the module questions consistently scored higher on physical, cognitive, and emotional functioning than those who refused to complete the modules. Specifically,
- module respondents are 5 times more likely than nonrespondents to perform all instrumental activities of daily living (IADL)
- module respondents are 3 times more likely than nonrespondents to perform all activities of daily living (ADL)
- module respondents are also more likely than nonrespondents to report better personal health, life satisfaction, emotional well-being, and are more likely to perform tasks that require mobility, strength, and fine motor skills.
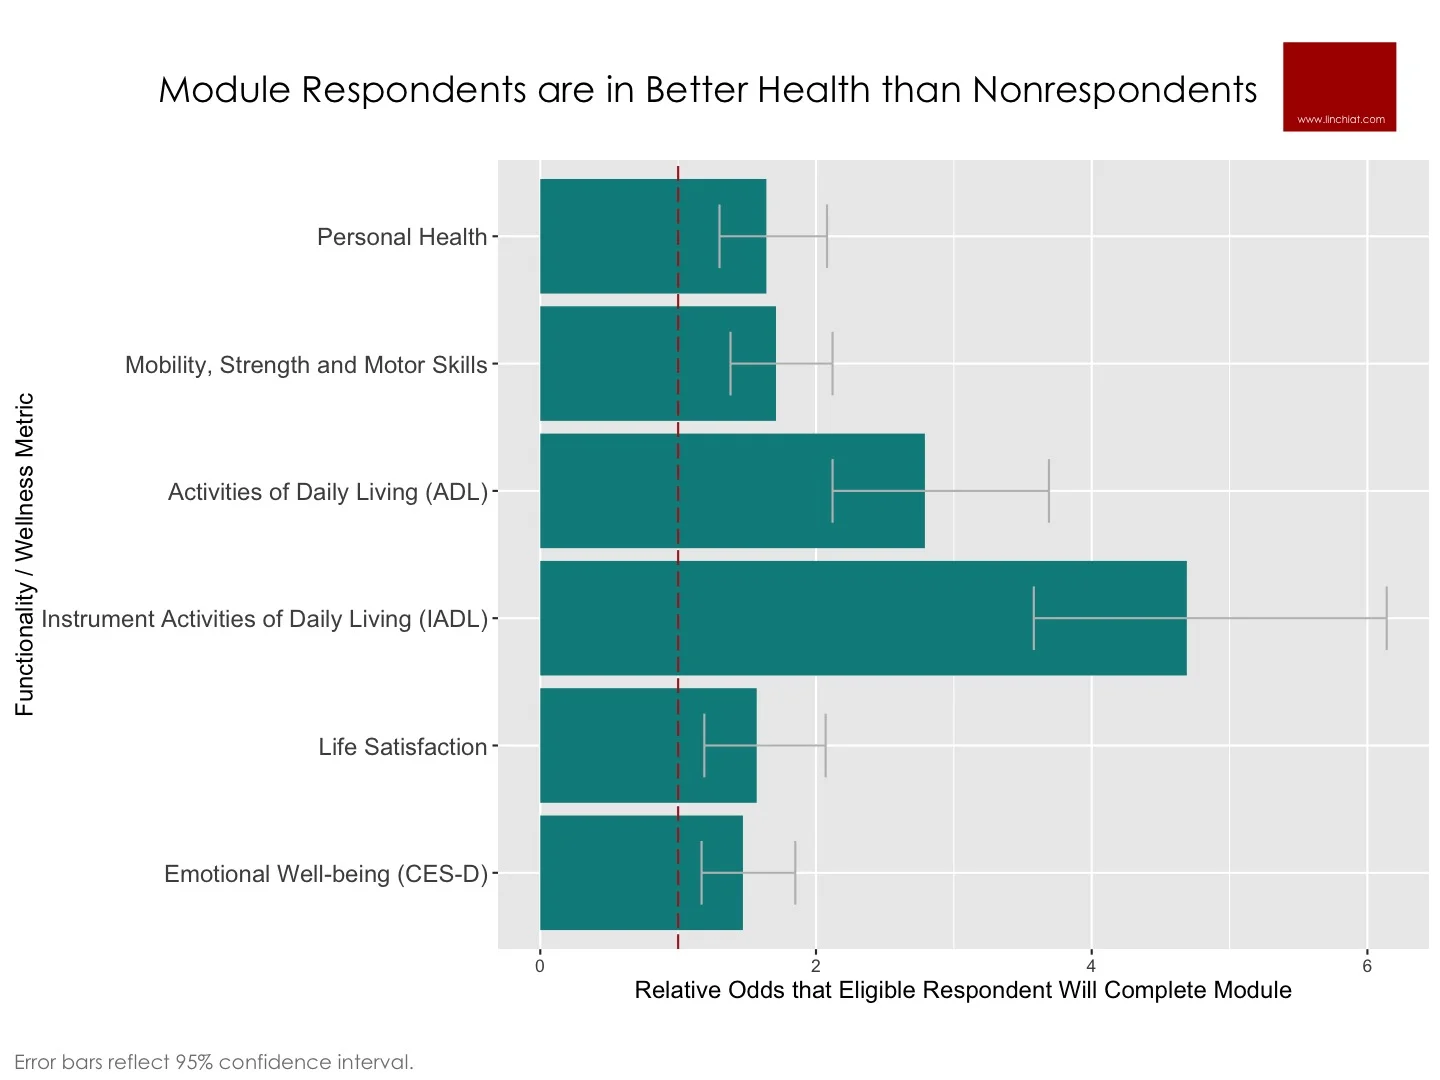
In sum, even though module subsamples are reasonably representative in terms of demographics, it is likely that respondents in the completed samples are in significantly better health than the target population of older adults to which we wish to make projections. This bias may be especially pronounced on survey questions that focus on health and functionality.
Did nonresponse vary by module topic?
Nonresponse rate did not vary significantly across the 11 modules (chi-square=11.3, p>.30), i.e. no one module suffered from higher nonresponse than other modules. Consequently, the completed samples exhibited similar demographic profiles, with no significant difference on:
- Age
- Sex
- Race
- Education
- Annual household income
- Total household assets
- Foreign born vs. born in USA
- Census region
There was also no difference across the 11 completed samples on well-being metrics such as general life satisfaction and personal health status.
Nonresponse Bias in Univariate Estimates
It is critical to ascertain if nonresponse is systematically associated with substantive variables, but the catch is we do not have substantive answers from the nonrespondents. Hence, some improvisation is needed. HRS paradata on respondents’ cooperativeness and contactability allowed us to simulate nonresponse propensity, and this afforded us a way to assess the extent to which nonresponse propensity is associated with substantive module variables.
We used 2 variables to assess the extent of non-contactability:
- Number of call attempts to contact respondent
- Flagged as hard-to-reach (HRS Tracker flag)
We used 3 variables to assess the extent of non-cooperativeness:
- Ever resisted when contacted (HRS Resist flag)
- Switched from enhanced Face-to-Face mode to telephone
- Uncooperative behaviors during interview
These uncooperative behaviors during interview included negative comments reflecting reluctance (e.g. time burden, confidentiality concerns, too old too sick, interview length is too long); expressions of annoyance / frustrations / had problems with survey; asked how much longer interview would take; as well as positive measures such as extent to which respondent was attentive, cooperative, and enjoyed interview, which were all reverse coded to align with the negative measures.
To demonstrate convergent validity of these 5 metrics of nonresponse propensity, we tested their strength of association with whether the respondent actually agreed or refused to complete the module. All 5 nonresponse propensity indicators were significantly and positively associated with increased odds that the respondent will refuse to participate in the experimental modules.
We selected a wide range of substantive measures from the 11 modules to assure a broad array of survey topics, including:
- Head/neck injury (car)
- Head/neck injury (fall)
- Head/neck injury (sports)
- Willing to delay ss benefits
- Limited time to live
- Use online health tools
- Search online for health info
- Good probability judgment
- Anxiety disorder
- Depression
- Moderate / light alcohol
- Read imaginative literature
- Sing or play music
- Dance
- Has financial management helper
- Expect to live longer than peers

It appears that the impact of nonresponse may be ignorable on certain module variables; whereas other module variables are more susceptible to nonresponse bias. After the Bonferroni correction is applied, the most pronounced biases remained significant.
Respondents who needed the highest number of calls to reach were…
- 2 times more likely to report a head/neck injury from a car accident
- 2.7 times more likely to report an anxiety disorder
- 3.2 times more likely to say they dance
Respondents who were assigned the HRS resist flag were…
- 2.5 times more likely to say they expected to live longer than their peers
- 2.7 times less likely to use online health tools
- 2.6 times less likely to search online for health information
Respondents who were assigned the tracker flag were 2.6 times less likely to say they expected to live longer than their peers.
Nonresponse Bias in Model Estimates
Given the potential nonresponse biases uncovered in substantive variables, the next step is to assess the extent to which nonresponse propensity magnified or limited the strength of associations between substantive variables. To this end, we ran multivariate models across multiple module topics based on above findings where a strong association was observed between nonresponse propensity and substantive variables.
We found no significant nonresponse bias in multivariate models. Over and over again, we found no significant interaction effect of nonresponse in moderating the expected effects between substantive module variables. For example:
- Nonresponse did NOT moderate the impact of dance on physical functioning measures of strength, mobility and fine motor skills
- Nonresponse did NOT moderate the impact of education or age on use of online health resources
- Nonresponse did NOT moderate the impact of physical, cognitive, or emotional well-being on expectations of longevity
In short, even though nonresponse bias was uncovered on a number of substantive variables, multivariate analyses consistently showed that substantive model results are not moderated by nonresponse. Hence, researchers who are looking to generate single point estimates should make some effort to assess nonresponse bias; whereas researchers who are looking at multivariate model output may be less likely to uncover effects of nonresponse bias.
Naturally, we did not do an exhaustive run of all variables across all 11 modules, so our conclusions are based only on the variables we have listed in above analysis.
Source: Chang, LinChiat and Mary Beth Ofstedal. 2016. Unit Nonresponse in the 2014 Health & Retirement Study Experimental Modules. Paper to be presented at the annual meeting of the American Association for Public Opinion Research in Austin, Texas.