Web sample providers routinely partner with external sources when their profiled panels are insufficient to fill sample sizes required in large-scale surveys. Such blended samples provide opportunities to evaluate response quality of respondents who are recruited and incentivized via different sources. This analysis of 40,000 consumers revealed that:
- Double opt-in panels performed better than other web sample sources.
- Completion time is one proxy but not the best metric of response quality.
- Superior performance of the best sample source was partially, but not entirely, attributable to socio-economic differences.
- Maximizing high quality sources in blended samples will minimize error variance.
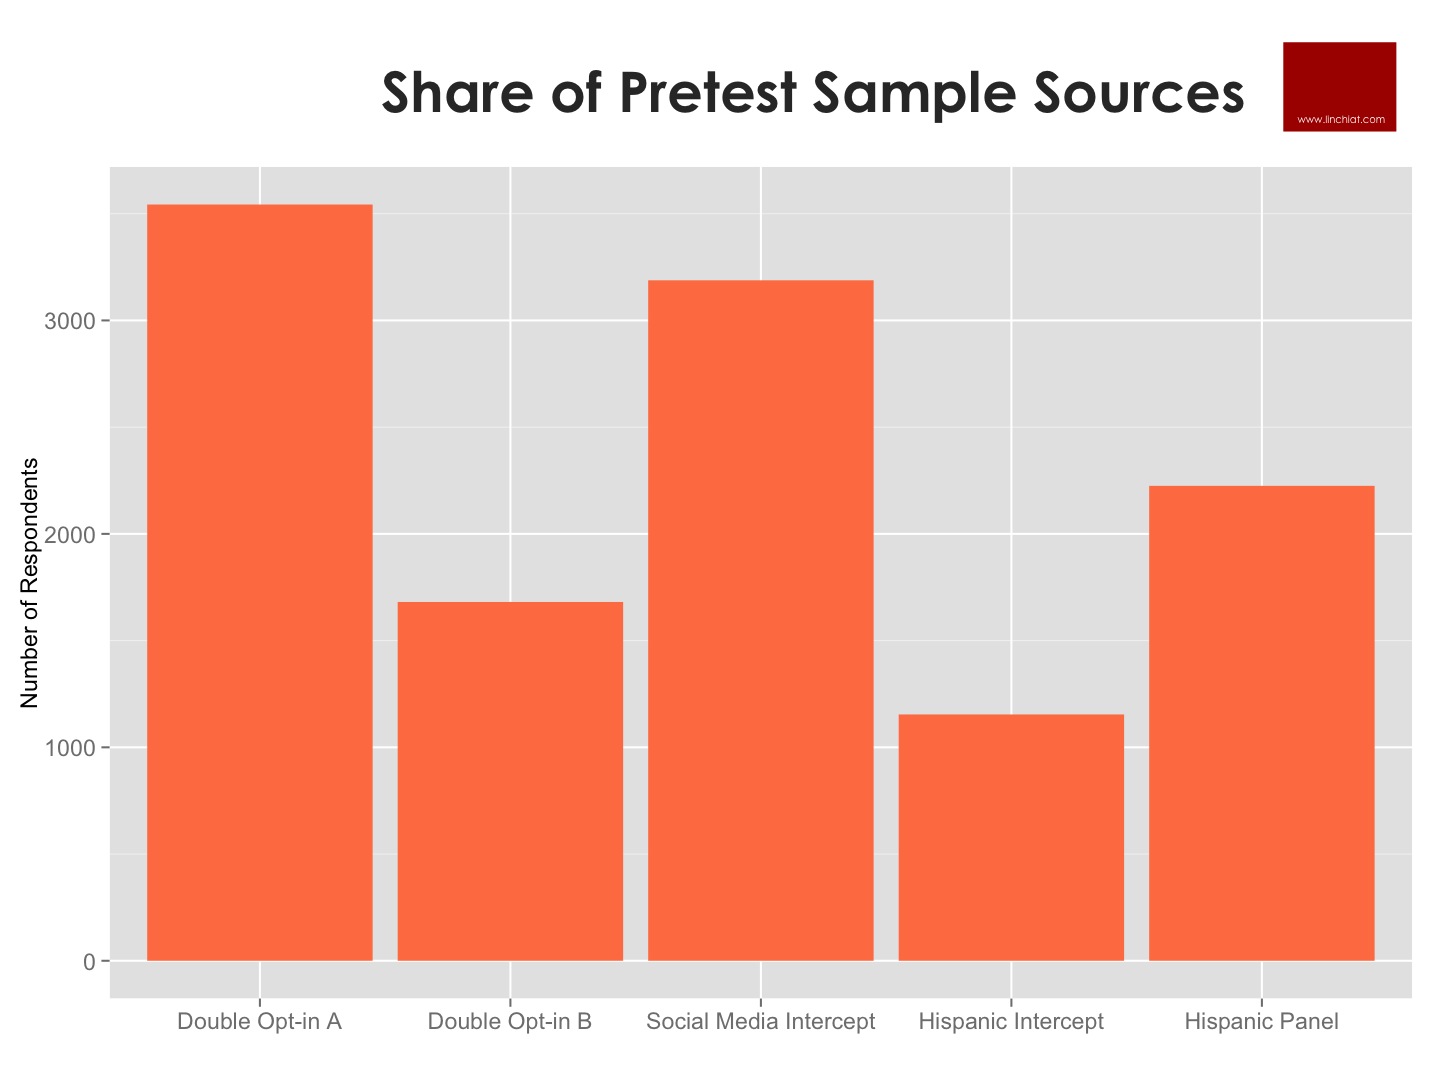
Profiled web panels have a finite universe. When in-house panels cannot meet sample sizes required in large-scale surveys, web sample providers routinely supplement their survey sample with external sources. In this study, a web survey of residents in top urban markets in the USA could not be fulfilled by any one sample source, and required blending of 5 distinct sources - including two established double opt-in web panels, one Hispanic specialty panel with recruitment both online & offline, one web intercept router with minimal profiling of respondents, and one intercept panel built from major social and gaming networks such as Facebook and Zynga.
Incentives for participation varied widely by sources, ranging from cash payments, Amazon gift cards, reward points for travel, restaurants, magazines, etc., and other rewards controlled by the original websites where the respondent was recruited. This blended sample provided an opportunity to evaluate response quality of respondents who are recruited and incentivized via different sources.
Incidence of Mindless and Inconsistent Responding
A data cleaning protocol was created to assess response quality throughout the survey. Although there is wide consensus that survey data should be cleaned prior to analysis, each cleaning protocol requires unique considerations specific to the survey questionnaire. A thorough review was conducted on available survey measures to extract opportunities to detect satisficing or mindless responding - including straight-lining on grid items, irrational or conflicting answers on separate items, highly unlikely answers and extreme outliers, nonsensical entries on open-ended questions, as well as unusually short survey completion times controlling for number of items answered. In this study, speeders are defined as respondents with lowest 25% completion time despite having answered more than median number of items on survey. Each respondent was scored on each separate metric of response quality, as well as an overall quality score combined across all metrics.
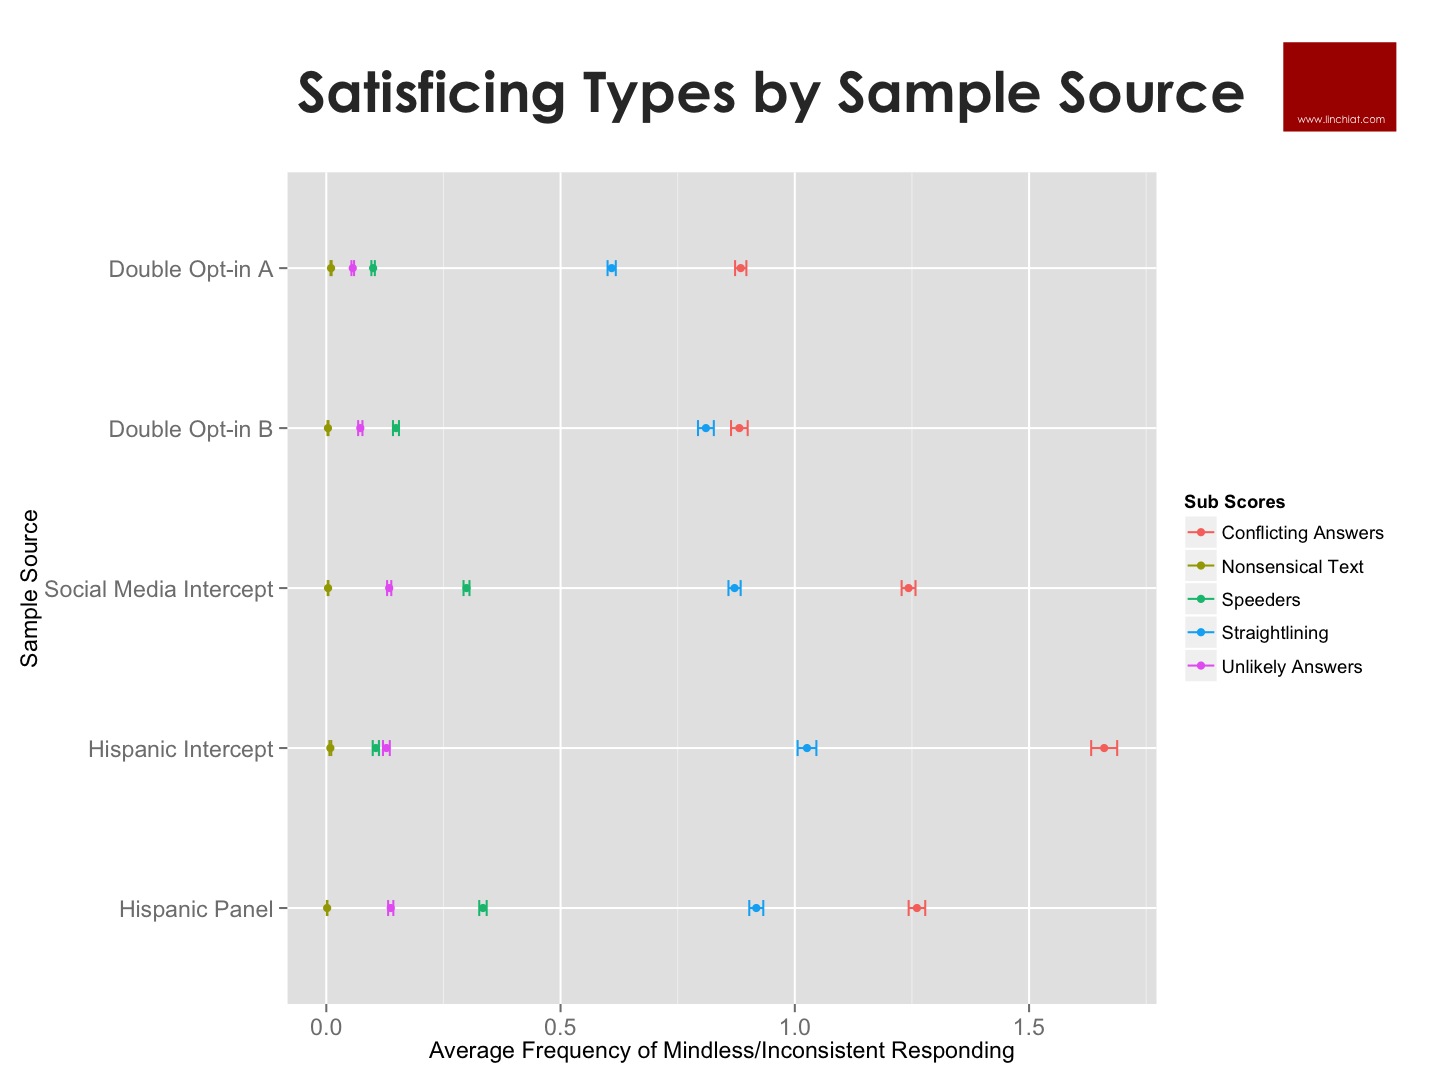
As shown below, both double opt-in panels performed better than other sources, and Double Opt-in Panel A consistently delivered respondents with lower tendency toward mindless responding compared to all alternative sources. The main effect of sample source on frequency of mindless responding was significant, F=122.3, p<0.001; as was all pairwise differences between sample sources with one exception: there was no significant difference in response quality between the Hispanic Specialty Panel and the Social Media Intercept Panel.

The sample sources also differed in types of mindless responding. For example, the two double opt-in panels exhibited about the same frequency of conflicting answers, but respondents from Double Opt-in Panel B were significantly more likely to engage in straightlining than respondents from Double Opt-in Panel A. Although respondents from the Hispanic Intercept Panel manifested significantly more conflicting answers and straightlining than other sample sources, they were less likely to speed through the survey and on average took more time to complete the same questions than respondents from other sources. In short, survey completion time was a good proxy but not the best metric of response quality in this study.
Controlling for Demographic Differences
Differences in response quality were evaluated across the five samples sources, before and after controlling for language of administration (English vs. Spanish) as well as available demographic and socio-economic attributes, including age, gender, race, household income, presence of children in household, home ownership, and type of home building structure. Output below from these models revealed that the superior performance of Double Opt-in Panel A was partially, but not entirely, attributable to differences in sample composition.

Improvement in Measurement Precision
Double Opt-in Panel A was thus identified as delivering higher response quality, and was used to fill the bulk of the sample requirement. Hence, response quality could be assessed with varying ratios of sample sources, in order to demonstrate how response quality could be progressively improved if the best sample source was a small fraction, about half, or formed the bulk (80%) of the final overall sample.
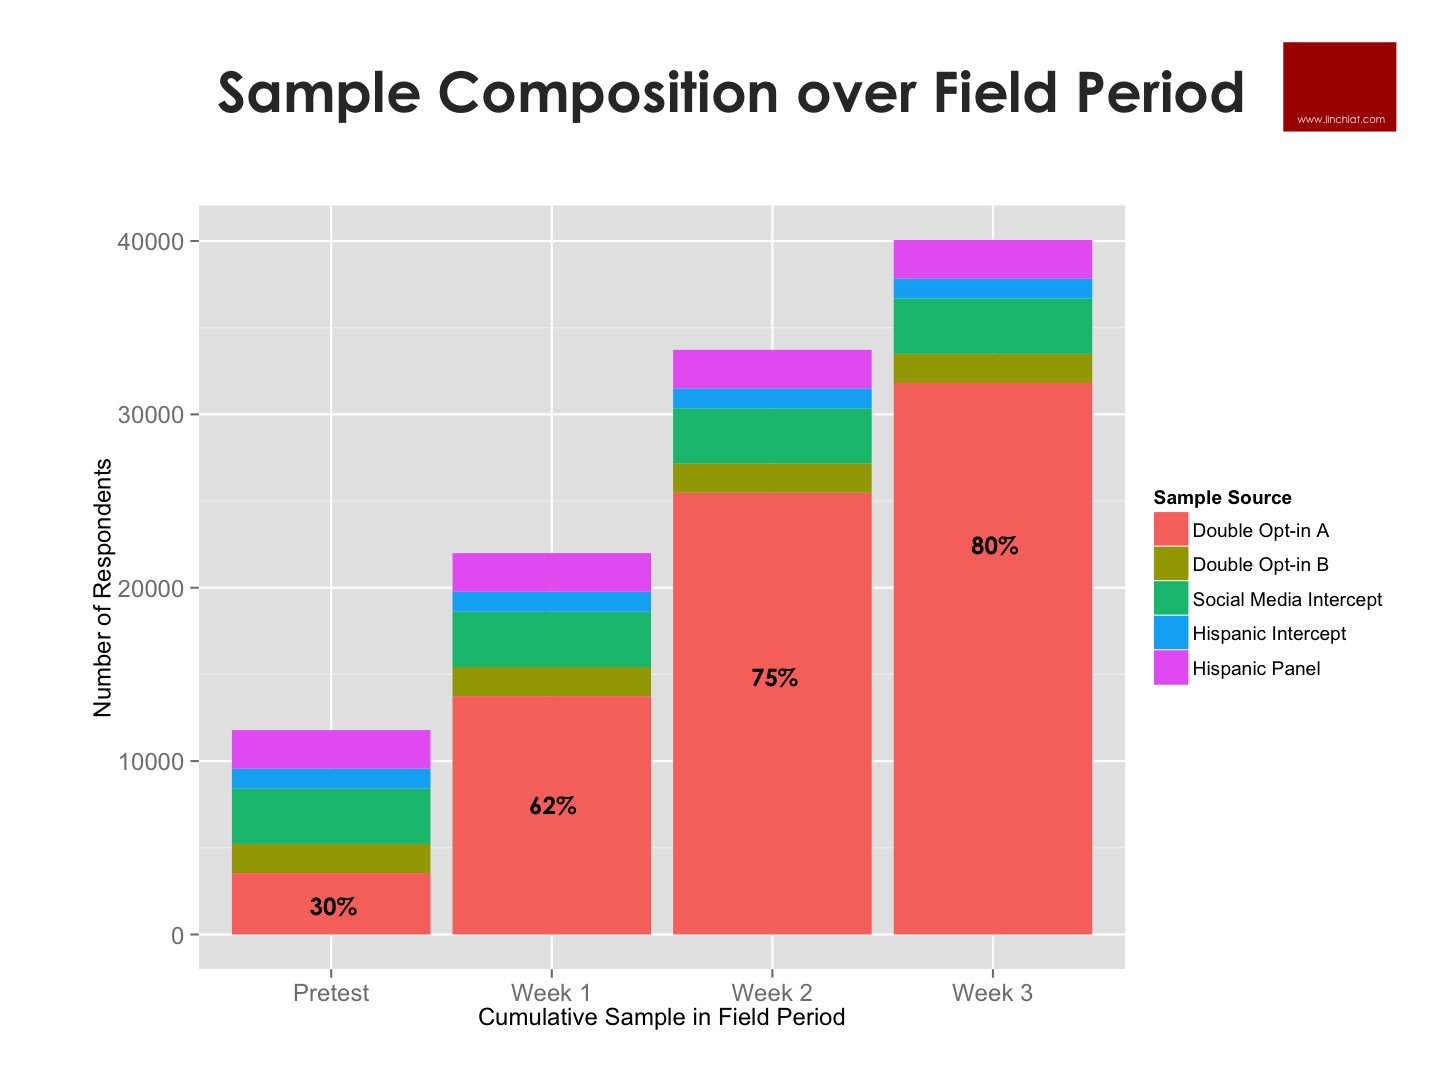
Clearly, average incidence of mindless or inconsistent responding consistently declined as the best sample source progressively accounted for a greater fraction of the full survey sample:

Point estimates and standard errors on substantive scale measures also changed significantly over the course of the survey field period. Below output illustrate the shifts in point estimates on a set of items asked early in the survey regarding transition to over-the-top (OTT) media, vs. another set of items asked late in the survey on perceptions of key arguments supporting or opposing net neutrality. It remains debatable whether the initial pretest sample estimates are farther or closer to the true population parameters than the final sample dominated by Double Opt-in Panel A, but it is clear that there is a consistent shift in survey point estimates with varying sample composition.


Standard errors is partially a function of sample size and thus tend to be lower for bigger samples. In contrast, the mean sum of the squared deviations, or mean sum of squares (MSS) represents more directly the average sum of squared differences from the mean - a proxy of measurement precision. As shown below, it is clear that data dispersion was much more pronounced in the pretest sample where the best quality source formed a small fraction of the full sample, while measurement precision is higher in the final sample where the best quality source formed the bulk of the full sample. The shifts are also more consistent on the early items than on the late items, possibly because all respondents regardless of source were more likely to be fatigued or keen to finish the survey when they answered the later items.


Finally, in a binary logistic model predicting support for net neutrality, we observe below shifts in model coefficient point estimates as well as margins of error at 95% confidence level. Evidently, the directional effects of each predictor remain the same regardless of sample composition, but when the best source formed the bulk of the final sample, the higher measurement precision allowed detection of statistically significant effects of the weaker predictors. These simulations confirmed that although lower quality responses tend to result in random noise rather than systematic errors in survey measurement, there are clear benefits of maximizing the proportion of higher quality sources in blended samples.

Source: Chang, LinChiat and Karan Shah. 2015. Comparing Response Quality across Multiple Web Sample Sources. Paper presented at the World Association for Public Opinion Research 68th Annual Conference in Buenos Aires.