
Summary
Nonresponse can bias survey estimates when core substantive measures are correlated with nonresponse propensity. This analysis of 35,000 sample adults from the 2013 National Health Interview Survey (NHIS) revealed that:
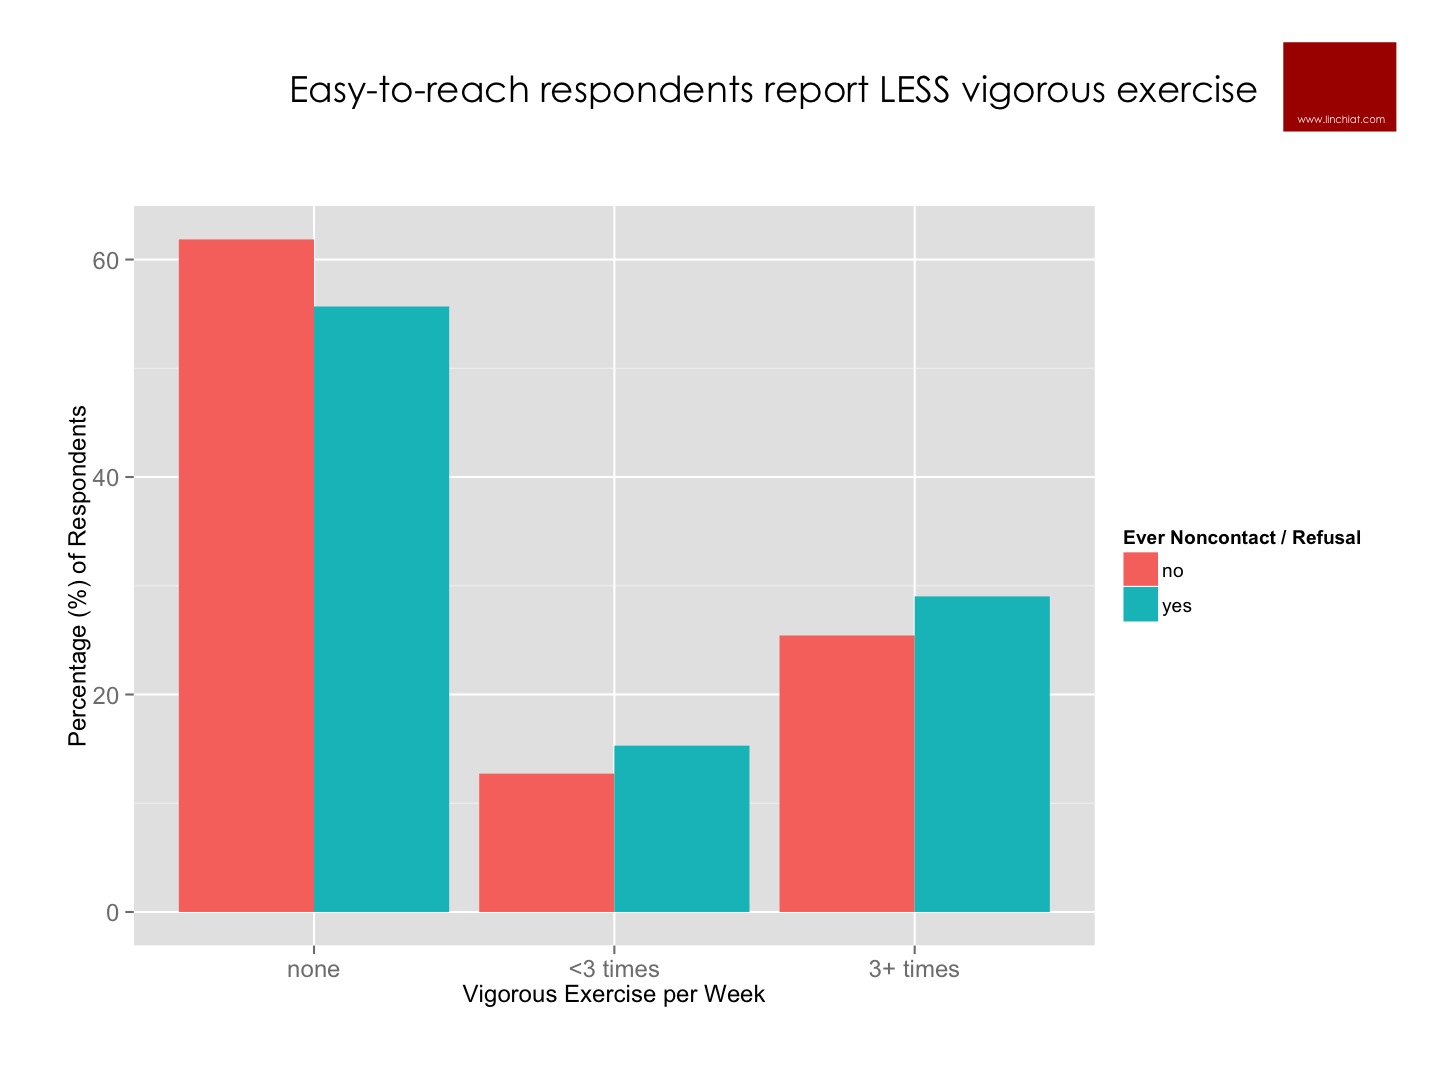
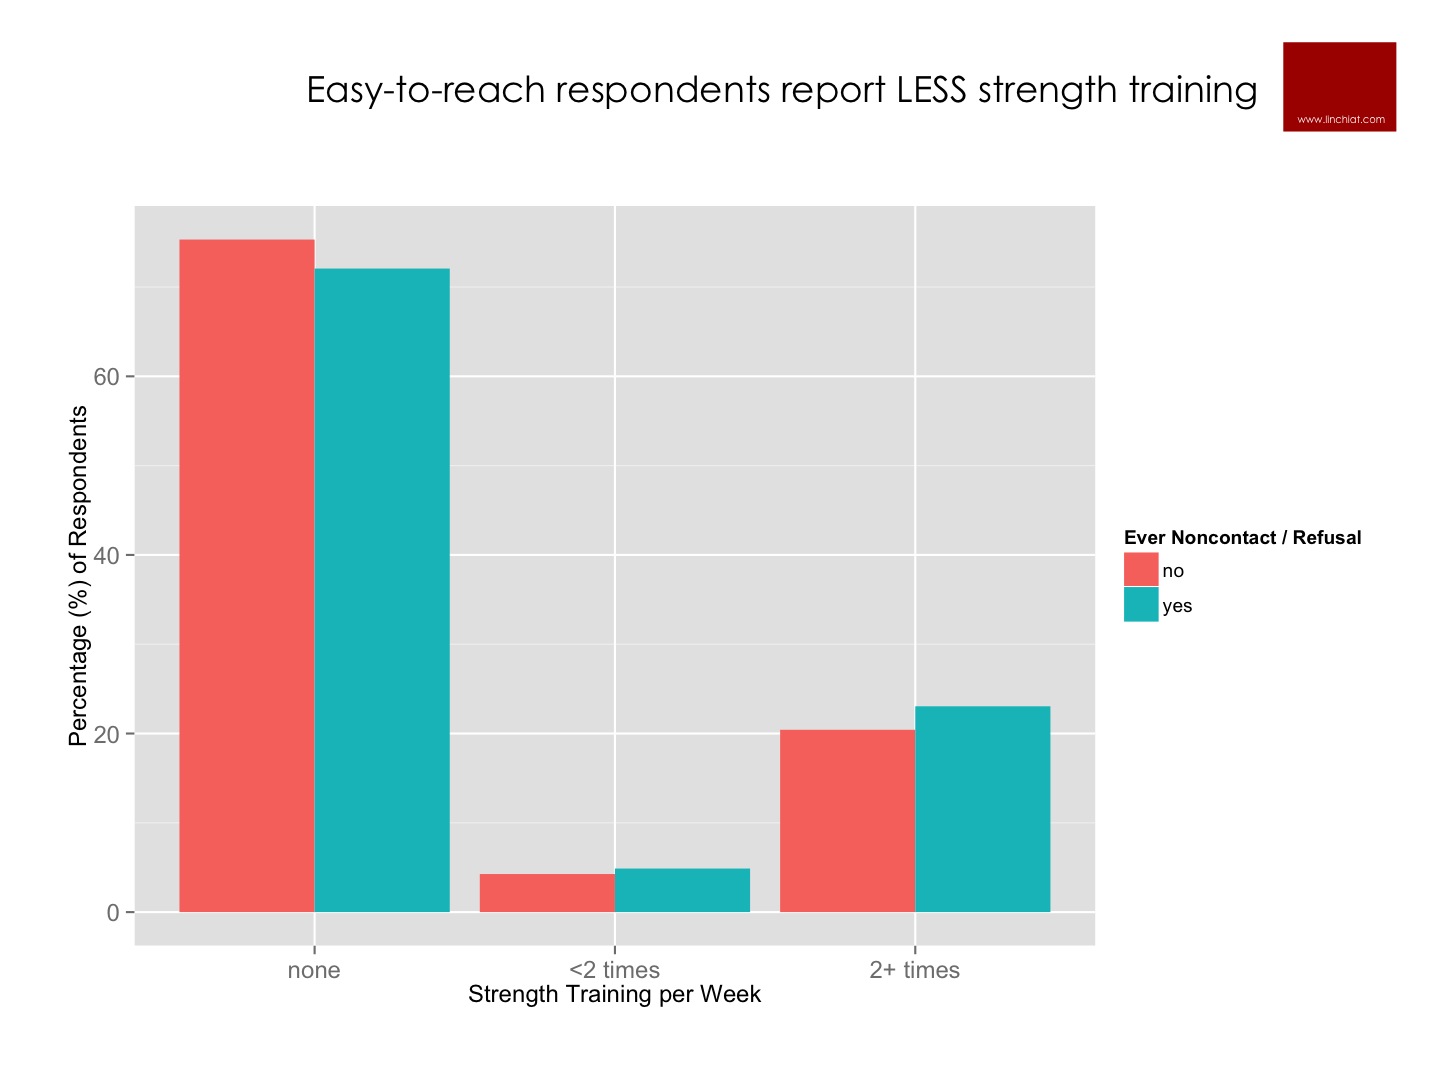
- respondents who were easy-to-reach reported less vigorous exercise and strength training
- respondents who were easy-to-reach and cooperative reported more trouble falling and staying asleep
- respondents who were easy-to-reach and cooperative reported more frequent use of sleep medications
The compounded biases imply that if a survey included only easy-to-reach and cooperative respondents, that survey would probably produce inflated estimates of sleep problems and depressed estimates of physical exercise. These nonresponse biases stayed significant even after controlling for demographic attributes and common chronic conditions such as obesity, diabetes and high blood pressure.
In addition to descriptive statistics, it is also critical to test whether nonresponse might compromise conclusions drawn from multivariate models. Analyses revealed that substantive model results could be undermined by nonresponse, because the impact of some predictors was weak or negligible among respondents who were easy-to-reach and cooperative.
Measures of Exercise & Sleep
Survey estimates of sleep and exercise are used in a wide array of domains from government tracking of population health, epidemiologic and academic policy analysis, to commercial development of products and services that purportedly enhance sleep or physical fitness. The 2013 National Health Interview Survey (NHIS) conducted by the U.S. National Center for Health Statistics (NCHS) collected data from 35,000 sample adults residing in the USA.
a. How much do people exercise? Physical fitness measures captured frequency of leisure-time physical activities in 3 categories:
- vigorous activities for 10 or more minutes that cause heavy sweating or large increases in breathing or heart rate;
- light or moderate activities for 10 or more minutes that cause light sweating or slight to moderate increases in breathing or heart rate;
- and activities specifically designed to strength muscles such as lifting weights or doing calisthenics.
b. How well do people sleep? Sleep measures included typical hours of sleep in a 24-hour period; as well as number of times in the past week respondent…
- had trouble falling asleep,
- had trouble staying asleep,
- took medications to aid falling or staying asleep,
- and woke up feeling rested.
Ignorable vs. Nonignorable Nonresponse
A critical distinction should be made at the outset. Survey nonresponse merely increases the risk of bias in survey estimates; that is, nonresponse does not necessarily result in bias. The degree to which survey nonresponse causes systematic bias is grounded in the extent of association between the core substantive measures and nonresponse propensity. If respondents who are difficult to reach or reluctant to participate have different responses on core measures from the respondents who are easy-to-reach, then we have a problem of systematic bias. Conversely, nonresponse may be ignorable if it is random and not associated with core substantive measures. There is an outstanding collection of academic studies on this topic here.
The NHIS releases paradata on the relative contactability and cooperativeness of respondents. Linking the paradata and survey data thus permits analysis of potential biases in survey estimates that could be attributable to nonresponse. The two key measures of nonresponse in this paper are:
- Ease of Contactability - Respondents were scored on how difficult it was for the field representatives to make contact with them, based on the number of attempts that resulted in noncontact; as well as whether the eligible sample adult was ever not available for survey.
- Degree of Cooperativeness - After contact is made, field representatives took note of reasons given for initial refusal or reluctance to participate, and also rated respondents on degree of cooperativeness, and likelihood to participate in the future survey.
The top 10 reasons for initial refusal to participate in the survey were, in order of prevalence:
- Too busy
- Privacy concerns
- The survey is too long
- Scheduling difficulties
- Cannot see/understand purpose or value of survey
- Not interested
- Survey not mandatory - respondents know they do not have to participate
- Family issues
- Anti-government sentiments
- Hostile/threatening behaviors from respondents too intimidating for field rep
Chart below displays percentage of respondents associated with each reason, as well as relative impact of each reason on field representative’s overall ratings of respondent cooperativeness. It is important to take note that this output is drawn only from adults who did eventually complete the survey, and excludes people who refused to participate or could not even be contacted. The prevalence of reasons among all sampled respondents is quite different and beyond the scope of this paper.

Opposing Forces of Contactability and Cooperativeness
The impact of contactability and cooperativeness on frequency of physical exercise were quite different. As displayed in below chart - respondents who were easy to contact engaged less frequently in physical exercise, whereas respondents who were most cooperative engaged more frequently in physical exercise.

One way to assess the combined impact of contactability and cooperativeness is to compare the exercise frequency of respondents who were never uncontactable and never reluctant, vs. those who were flagged as a noncontact or refusal at least once. These comparisons reveal that respondents who were harder to reach engaged more frequently in vigorous exercise and strength training than those who were easy to contact.
Compounding Forces of Contactability and Cooperativeness
The impact of contactability and cooperativeness on frequency of sleep quality were better aligned. As displayed in below chart - respondents who were easy-to-reach and more cooperative reported more trouble sleeping and more frequent use of sleep medications. The only exception was frequency of waking up feeling rested, where again we see opposing forces of contactability and cooperativeness - such that easy-to-reach respondents reported higher frequency of restful sleep whereas cooperative respondents reported lower frequency of restful sleep. Nevertheless, the compounded biases imply that a survey that included only easy-to-reach and cooperative respondents would probably produce inflated estimates of sleep problems.

Controlling for Demographics and Chronic Conditions
Given the above evidence that respondent contactability and cooperativeness were systematically associated with sleep and physical exercise, the next step was to explore whether these biases could be explained by respondent attributes. For example, if easy-to-reach adults reported less vigorous exercise, could that be due to a third variable such as age, whereby older adults are easier to reach and also engage less frequently in vigorous exercise?
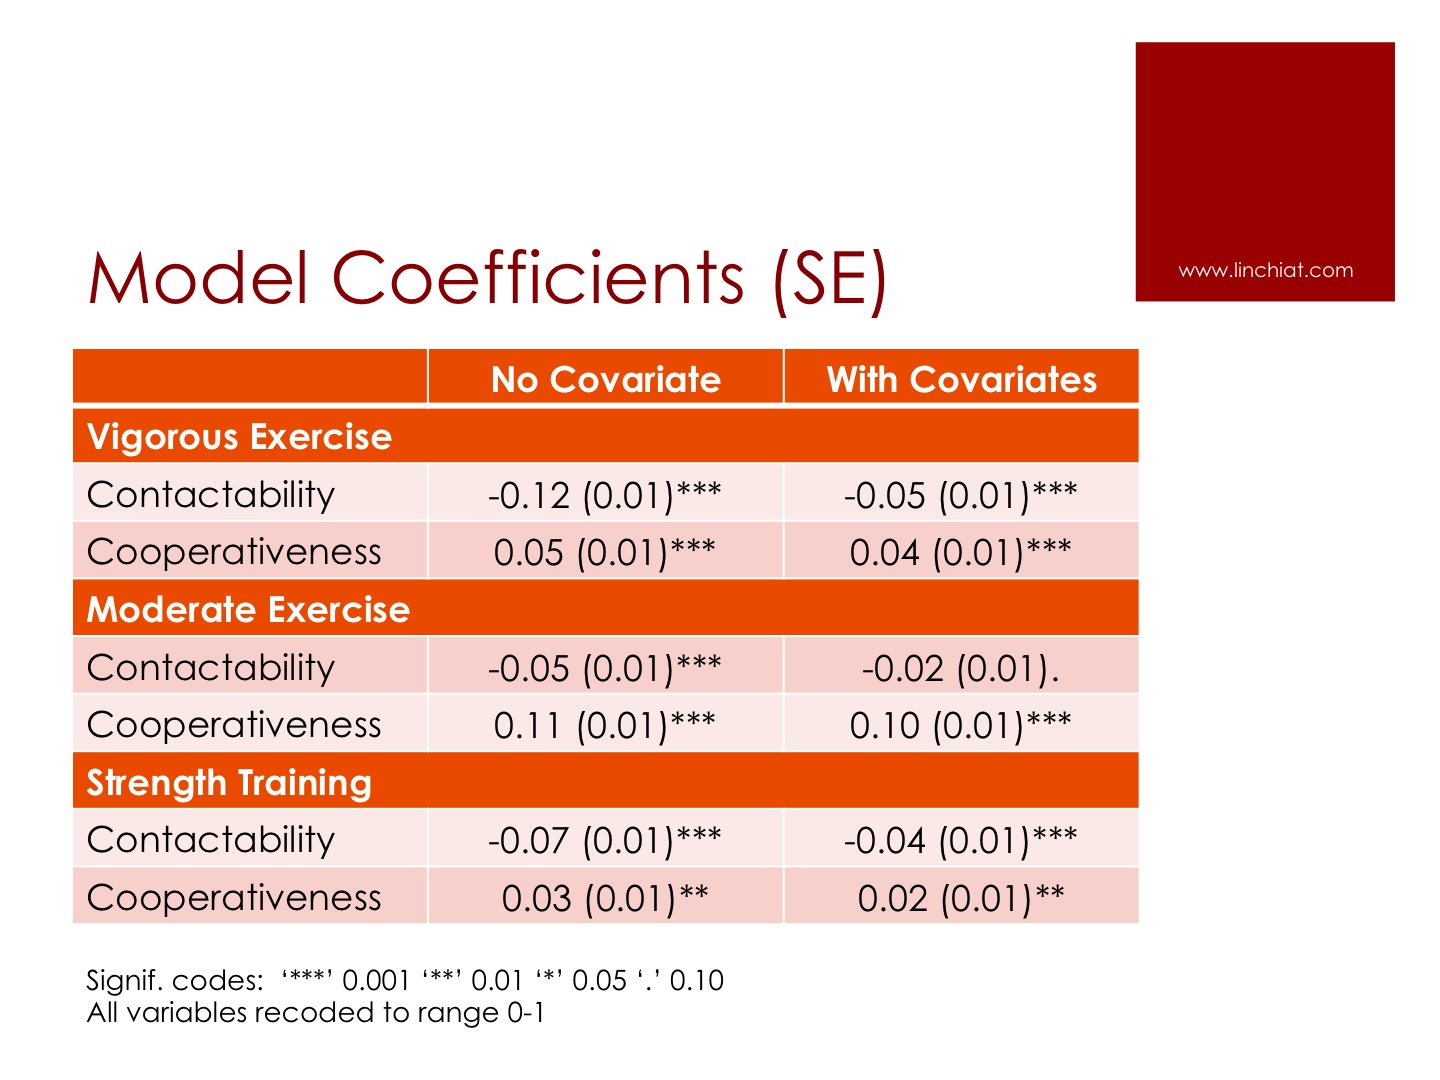
To this end, I repeated the same models testing the impact of contactability and cooperativeness on each measure of exercise and sleep; now controlling for below covariates:
- Age, gender, race, household income
- Obesity
- Current Smoker
- Diabetes
- Hypertension
- Hyperlipidemia
As shown below, it is clear that the impact of contactability is somewhat reduced after controlling for demographics and chronic conditions, but there is practically no change in the impact of cooperativeness.

Moderating Effects in Multivariate Models
In addition to basic proportional estimates, it is also critical to test whether nonresponse might compromise conclusions drawn from multivariate models. For example, there is a main effect of household income in the strength training model, such that adults in more affluent households engage more frequently in strength training during their leisure time than adults in less affluent households. However, note below significant negative interaction between contactability and household income, such that the income effect is 3 times weaker among easy-to-reach adults than hard-to-reach adults.

In another model predicting sleep issues, there are significant main effects of negative emotions, such that adults who often felt restless or hopeless also report higher frequency of trouble falling sleep. Again, note below significant negative interactions between contactability and these two negative emotions, implying weaker effects of restlessness and hopelessness among easy-to-reach adults than hard-to-reach adults.
Further, an interaction effect emerged between cooperativeness and how often respondents felt that everything takes effort. In general, adults who felt everything required effort in the past month reported higher frequency of trouble falling sleep than adults who felt less overwhelmed. However, this main effect was moderated by degree of respondent cooperativeness, such that this effect is 3 times weaker among cooperative respondents than reluctant respondents.

Taken together, this analysis revealed that substantive model results could be undermined by nonresponse, because the impact of some predictors was weak or negligible among respondents who were easy-to-reach and cooperative.
Source: Chang, LinChiat. 2015. Impact of Nonresponse on Survey Estimates of Physical Fitness and Sleep Quality. Paper presented at the annual meeting of the European Survey Research Association in Reykjavik, Iceland. <PPT>