
The National Health Interview Survey (NHIS) is a superb source of estimates on many metrics tracking Americans' health status, health behaviors, and access to health care. Although invaluable, the NHIS public use data provides estimates mainly at the national level and the 4 census regions - Northeast, Midwest, South, and West. In contrast, many providers of healthcare services do not cover the entire nation or geographies that align well with census regions, so these broad geographical cuts are of limited value to business decisions and strategies in smaller geographies.
The American Community Survey (ACS) public use data provides data at the level of Public Use Microdata Areas (PUMAs), which permit flexible cuts of geography. PUMAs are geographically contiguous small areas based on counties and census tracts. They are nested within states and major cities, and contain at least 100,000 people. In the ACS 2012 public release data (latest available at this time), there were 2,351 PUMAs, and the average sample size by PUMA was 1,016 adult respondents.
This paper sought to generate estimates of 3 population health indicators for geographies that could permit more flexible alignment with service provider footprints:
- Proportion of Adults in Poor or Fair Health
- Proportion of Adults who work out vigorously at least once per week
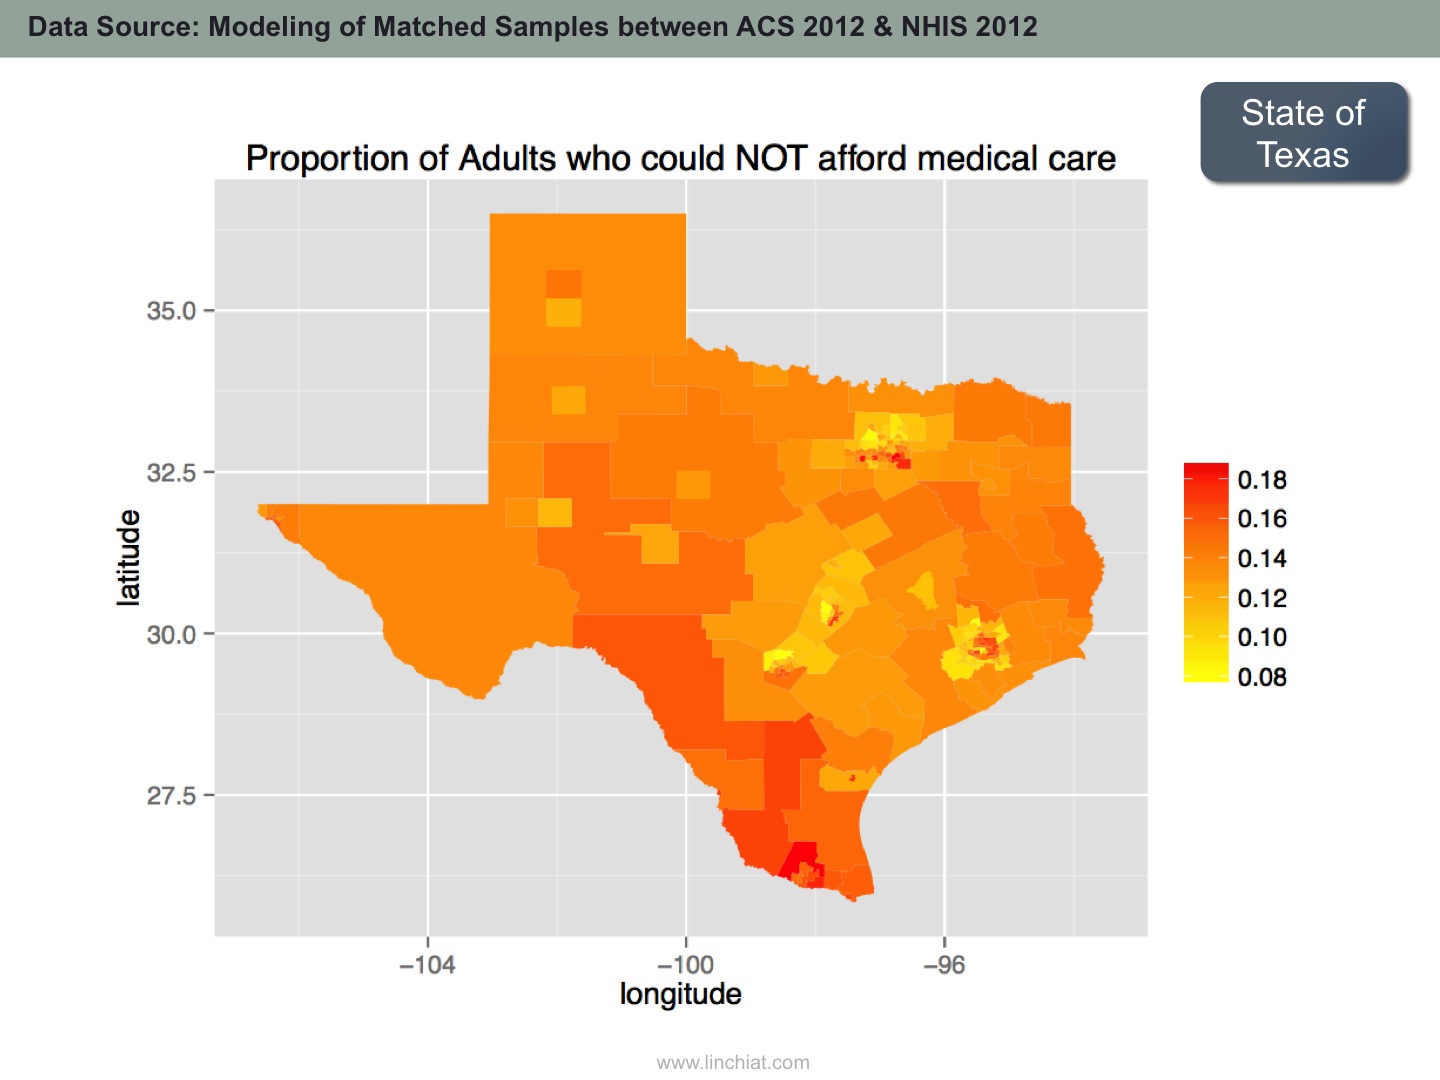
- Proportion of Adults who could NOT afford medical care in past 12 months
The same methodology can be applied on a plethora of other population health metrics; these 3 variables were selected to demonstrate the feasibility of the approach across different domains of population health.
SAMPLE OUTPUT
METHODOLOGY
First, a thorough review was conducted to identify pertinent socio-economic and demographic variables that are available or could be derived from both NHIS and ACS data, such as age, gender, race and ethnicity, household income, household size, presence children in household, education, employment, industry sector, primary occupation, cognitive and physical functioning, health insurance coverage and other predictors and covariates of health status and health behaviors.
Next, matched samples were drawn from NHIS to simulate ACS PUMA samples. Each PUMA sample was matched to 50 NHIS samples for the corresponding census region. For example, a PUMA sample in California would be matched to the "West" census region sample from NHIS. The samples were matched on only a small subset of covariates to maximize variability in the matched samples.
Next, the matched samples was split 4:1 into training vs. testing data sets such that models could be trained on only a random subset of 80% of the matched samples; and then evaluated using the remaining 20% of matched samples. This step is critical as flexible learning algorithms can easily overfit training data but perform poorly on subsequent new data streams. To further reduce overfitting, hyperparameter tuning & cross validation were executed where applicable. A priori, it was not possible to ascertain which machine learning algorithm would perform the best, so 4 different methods were attempted on the same data - namely:
- Decision Tree
- Random Forest
- Support Vector Machine
- Neural Network
Model accuracy was assessed using MSE (mean square error), i.e. the cross product of the difference between true value vs. predicted value, divided by number of test data points. It turned out that combined predictions of SVM and Random Forest performed the best on predicting proportion of adults in poor/fair health and proportion of adults who could not afford care; while SVM alone performed the best on predicting proportion of adults who exercised vigorously at least once per week.
Correlations were consistently high between predicted vs. true values in the testing data:


There is also excellent external validation from the Behavioral Risk Factor Surveillance System (BRFSS), which administers almost the same survey question on personal health status, and produces state-level estimates on proportion of adults in poor/fair health. Although the point estimates are different, the predicted estimates and the direct estimates from BRFSS are highly correlated.

Source: Chang, LinChiat. 2014. Estimating Population Health in Selected Geographic Areas: Applying Machine Learning Algorithms on Large-scale Survey Data. Paper presented at the annual meeting of the American Association for Public Opinion Research.